Alarms
Understanding alarm types, severity, and the tracker widget.
Alarms
An alarm is an abnormal state raised by a device — e.g. a leak, a blocked meter, or an out-of-range temperature. Drexo tracks each alarm's state over time: when it was raised, when it was resolved, how many devices are affected.
The page slug stays
/alarmesin both locales so the language switcher round-trips cleanly. The content here is the English source of truth.
Where to see alarms
Four surfaces, by depth:
- Top-bar badge — the
⚠ Npill on the right, clickable, leads to the full page. - Alarms page — full-screen view of every active alarm, sorted by type.
- "Alarms" widget — pinnable on any of your personal dashboards.
- Device page — active alarms + transition history for that single meter.
All these surfaces read the same source of truth and are RLS-scoped: you only ever see alarms for devices you already have access to.
The /alarmes page
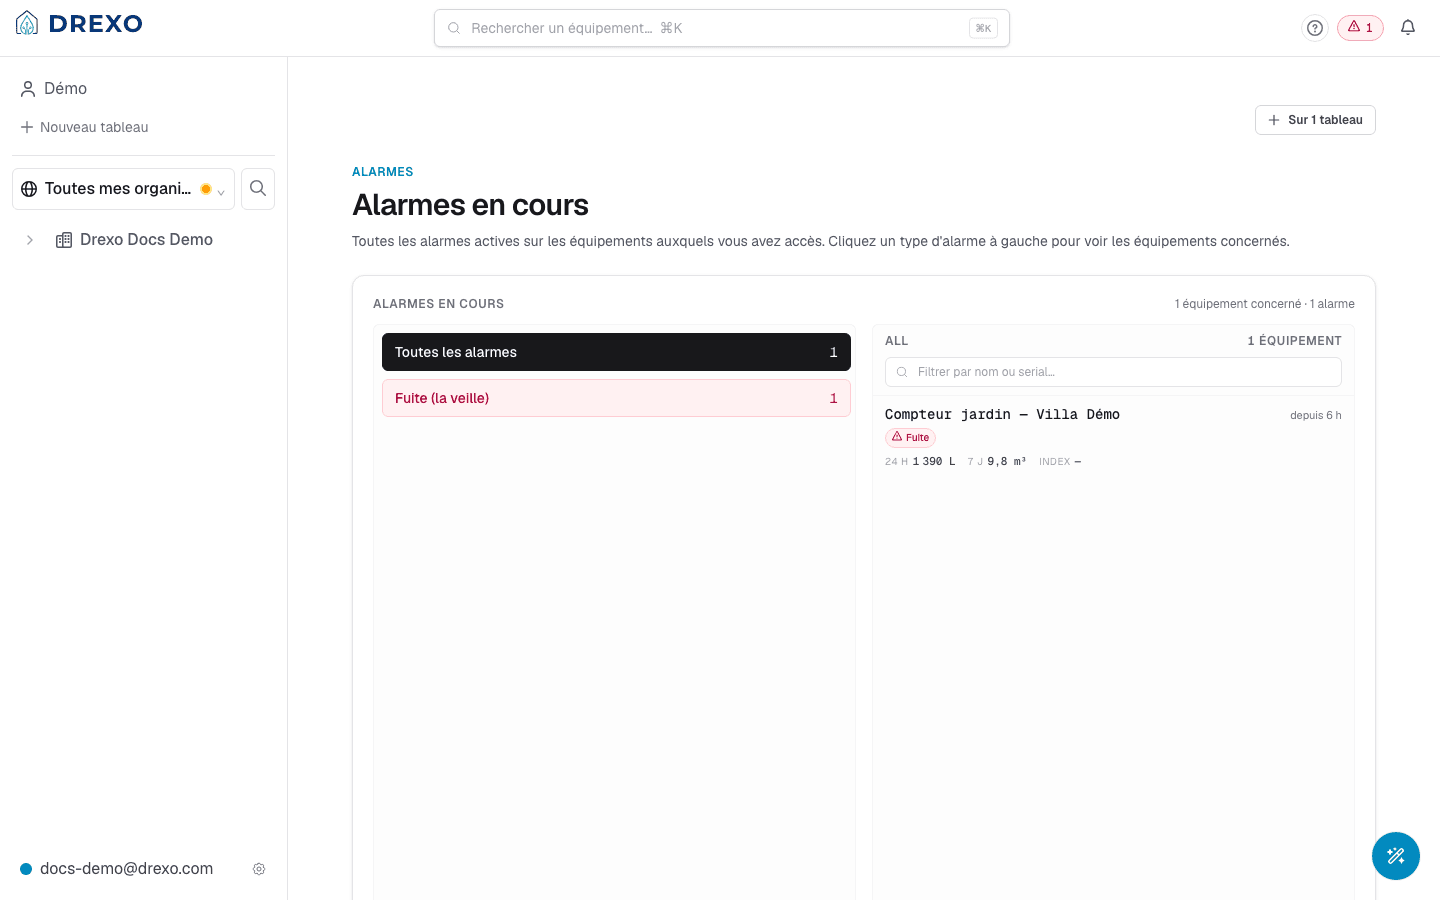
Two side-by-side panes:
- On the left, the list of active alarm types in your scope, with the number of affected devices next to each. Sorted by severity desc: leaks at the top, informational alarms at the bottom.
- On the right, for the type selected on the left, the list
of devices currently in that state. Each row shows:
- the contextual device name,
- the raised-at date,
- recent metrics (24h, 7d, current index),
- a direct link to the page.
At the top of the page, the Pin widget on selector lists your personal dashboards. Tick those that should display the same view — the widget becomes visible on as many boards as you want (the pin is per-dashboard, the alarm state itself is unique).
Alarm types
Itron Intelis wSource meters report about a dozen types. Drexo groups them by severity:
High severity
Recommended action: act quickly.
- Leak (previous day) — continuous consumption for 24 h with no meaningful pause.
- Backflow (previous day) — reverse flow detected.
- Broken pipe — persistent state. Drexo keeps it raised until the meter explicitly reports the resolution.
- Blocked meter — the wheel isn't turning despite expected demand.
- Magnetic tamper — a magnet was detected near the sensor.
- Removed meter — the device has been dismounted or uncoupled.
- Battery — low level reported by the meter itself.
Medium severity
Recommended action: monitor, schedule a visit.
- Peak flow (previous day) — hourly spike above threshold.
- Air in pipe (previous day) — air bubbles detected.
- High / low temperature (previous day) — out of normal range.
- Scaling — the meter's internal computation.
- Battery (estimated) — not a direct meter signal, estimated by Drexo from behaviour.
Low severity
Information, not urgency.
- High / low monthly volume — threshold breach on last month's total.
- Reserved meter — inventory flag.
- NFC credit — payment / authorisation event.
Alarm lifecycle
- The meter emits a LoRaWAN frame with the flag raised.
- Drexo receives the frame via n8n + InfluxDB and writes a row
into
eau_alarms(table is append-only — no silent modification possible). - The alarm appears instantly across every surface listed above.
- When the meter later emits a frame without the flag, Drexo writes a "resolved" transition into the same table.
- The device page surfaces that transition in the history.
Alarms are never modified retroactively: if you see a "Leak" alarm raised yesterday morning and resolved this morning, both rows remain in the history even after the event.
Receiving notifications
Not yet — pushing or emailing on alarm raise is tracked in our product backlog (the iOS / iPadOS app initiative, which will bring APNs with fan-out via an Edge Function). For now, the top-bar badge serves that role in the web app.
Going further
- Device page — per-meter history.
- Dashboards — pin the alarms widget to your boards.
- Sharing — a share grants access to the shared device's alarms too.